Mixing share formats on Facebook is crucial for traffic performance
- To maximise Facebook traffic, your page needs to share a mix of formats including links, images, videos and carousels
- The optimal proportions between formats varies from page to page
- Echobox's automation learns and fine-tunes your page's ratio to find its optimum
A healthy mix of different share formats (link posts, image posts, video posts and carousel posts) is essential when posting to Facebook, and can generate huge increases in traffic and engagement compared to making only traditional link posts.
At Echobox, we are constantly analyzing performance and running experiments to determine the optimal ratios between different share formats on Facebook. It’s now more important than ever to include a broad mix of formats including link, image, carousels and videos. If you aren’t currently mixing share formats on Facebook (for instance by solely relying on traditional link posts), it’s crucial you start.
We can see a comparison of publishers who share only link posts with those who share a broad mixture of formats. In the index graph below, both groups start from the same point (100) to make the comparison clearer. At every stage, those sharing a mixture of formats outperform those that don’t, demonstrating just how detrimental a sole focus on link posts has become.

Image posts, in which a link is placed in the first comment, are an essential part of a publisher’s share mix — leading to prioritization by Facebook’s algorithms and allowing for increased referral traffic.
In this real example below, we can see two shares of the same article: on the left a conventional link post, on the right an image post with the article’s URL placed in the first comment.
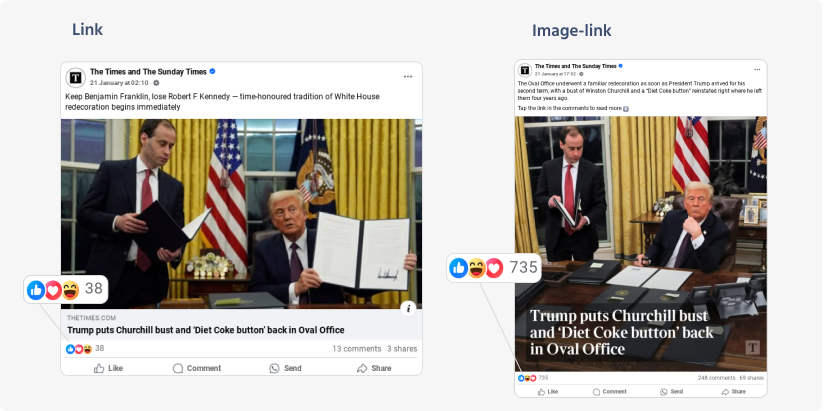
As we can see, the image post achieved 20x more engagement. This far higher amount of engagement usually translates into more referral traffic, as more people will click the link in the first comment than they would on a traditional link post (due to Facebook’s algorithm).
These results transfer from the post to the Page level. When looking at the performance of Pages that begin to include images into their share mix, we see that there is an immediate increase in referral traffic.
Analyzing the numbers, introducing image shares leads to an average increase in traffic of around 15%. There is significant variation, though. Some publishers achieve an uplift of 60% and above.
Here, for instance, is an example of a publisher’s traffic when they started making image shares alongside their traditional link shares:
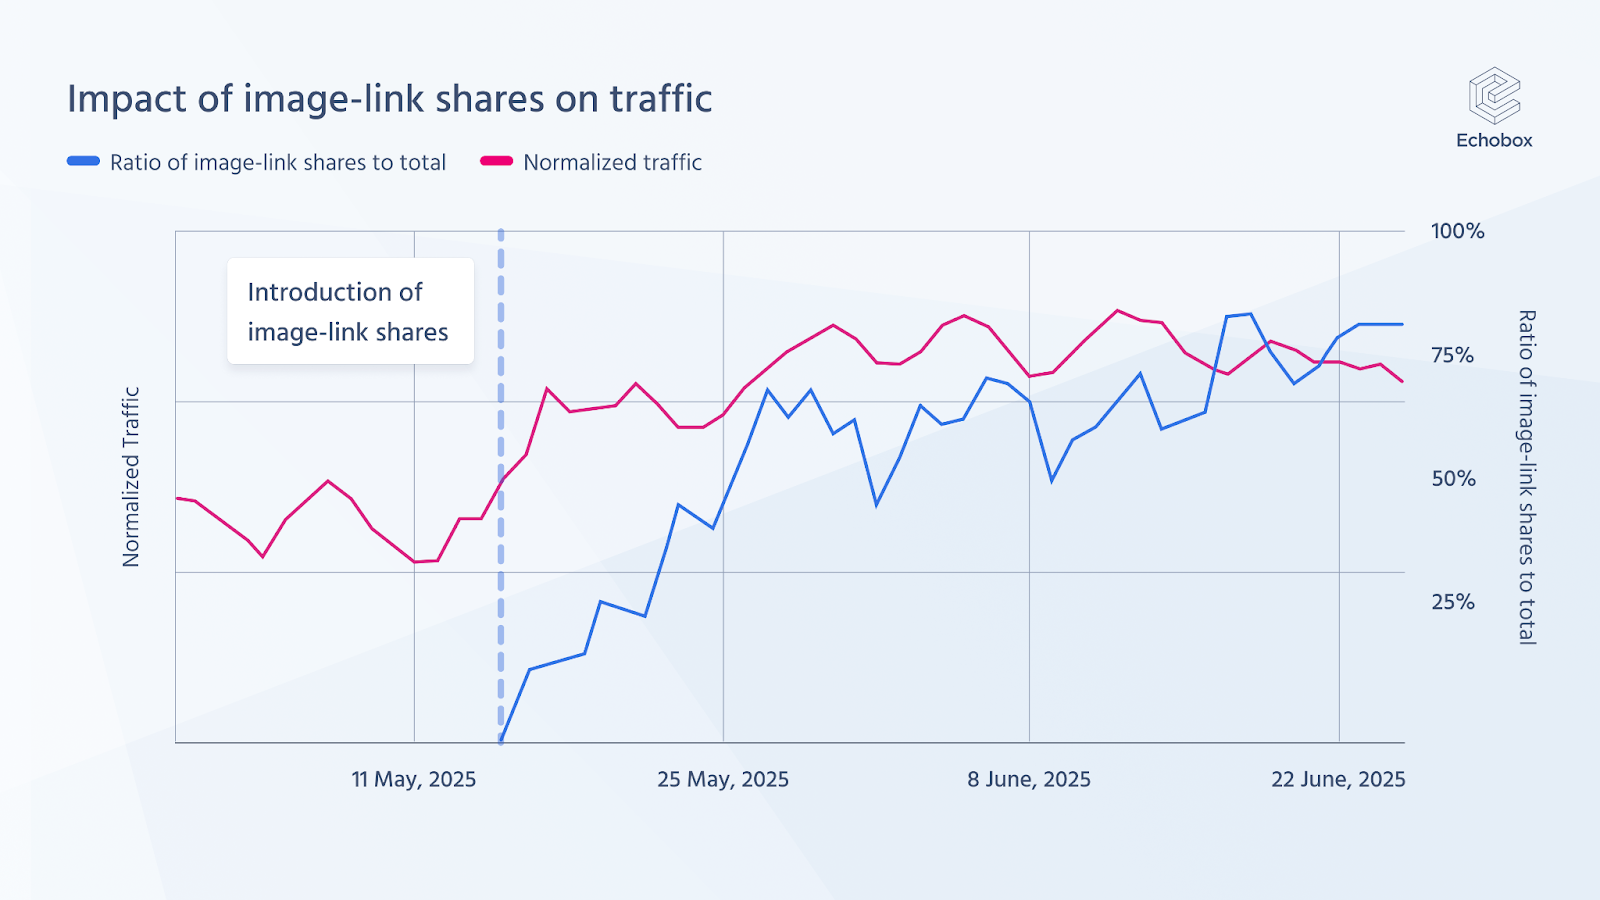
As we can see, the introduction of image shares (the period beginning at the dotted line) corresponded with a significant and sustained upswing in traffic (the rise in the red line). Given this increase in Facebook traffic, Echobox’s automation will continue to post more and more image shares, automatically testing for an optimal ratio of image shares as a percentage of total shares to maximize traffic.
The same applies to videos and carousels. Echobox will determine what the optimal ratio is in order to maximize your overall traffic.
What’s the optimal ratio?
If you are already mixing share formats, then it’s crucial you find the optimal ratio between the different formats. For instance, should you be posting 20% of your shares as images, or 40%?
We ran experiments with select customers of ours and tested different ratios. We found that there unfortunately isn’t a single optimal ratio for all. It can vary widely, with some publishers required to make 60% or more of their shares as image shares for maximum traffic, and others 10% or less.
In the graph below, we can see the optimal image share ratios for a number of different Pages. The horizontal x-axis splits these into ranges (0%-10%, 10%-20% and so on) from 0% to 100%. These ratios have been determined by Echobox continuously adjusting the number of image shares made until maximum traffic is reached.
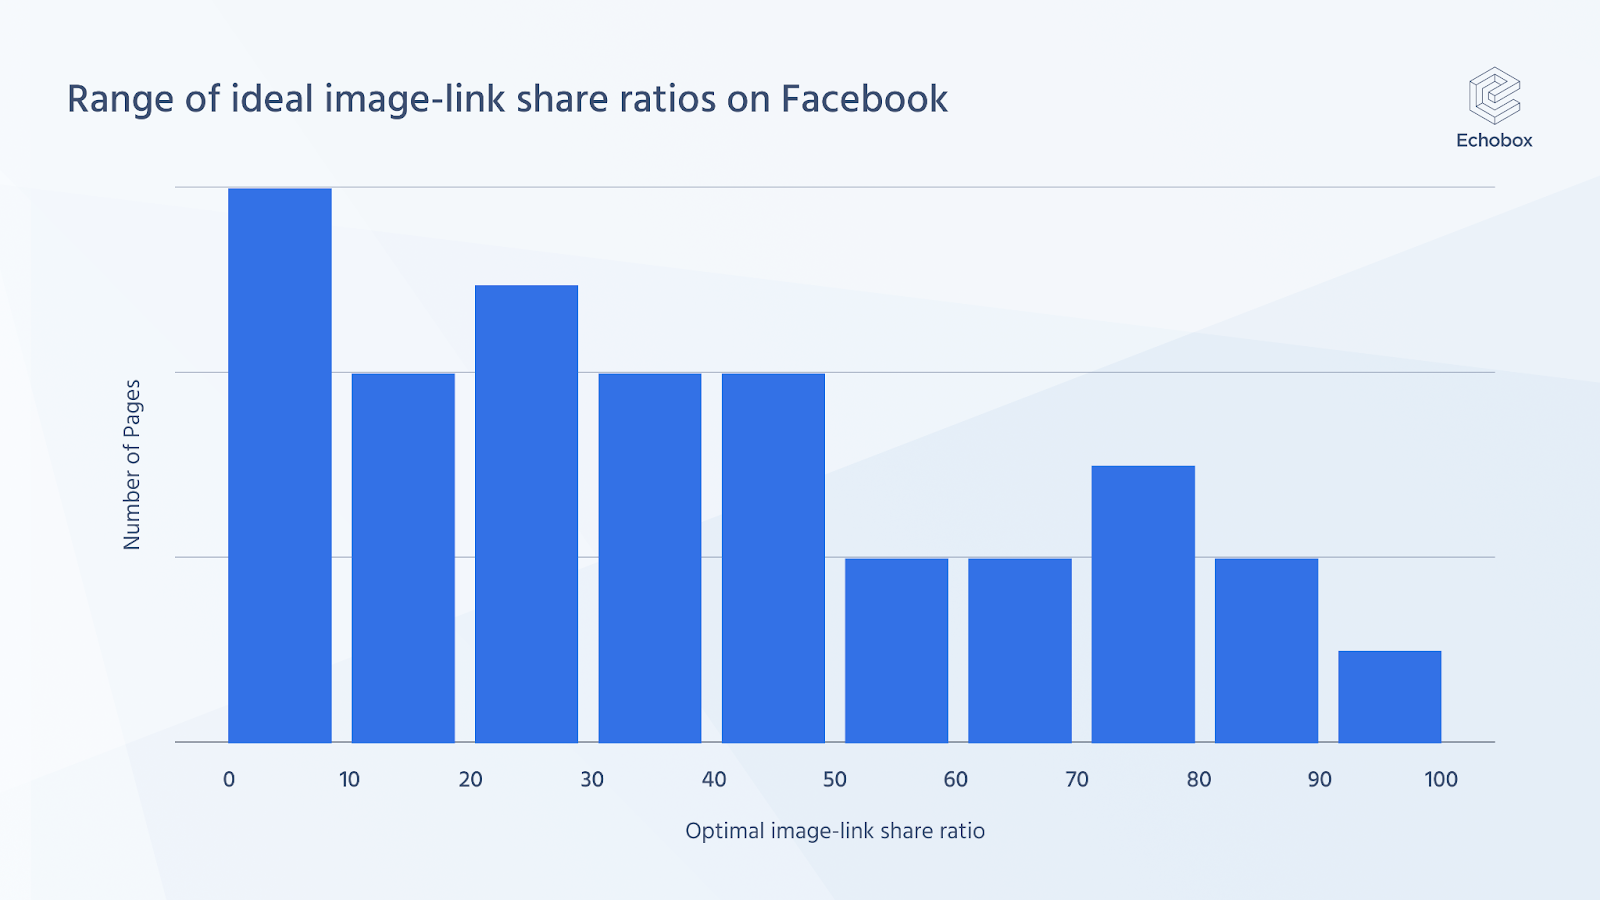
From this, we can see the wide distribution of optimal image-link share ratios across Pages. The average optimal ratio of image shares is somewhere between 40%-50%. But there is a substantial group for whom the optimal ratio is higher and lower. Indeed, for some Pages studied, the optimal ratio lies somewhere within the 90%-100% range.
These findings demonstrate just how different the optimal share ratio is for each Facebook Page. A number of factors can have an influence. The expectations of the Page’s audience, the Page’s content, the templates used, the share messages and Facebook’s own internal perspective of a publisher all affect the ratios.
Takeaways
What do these experiments mean for you and your sharing strategy?
- Having a mix of share types when posting to Facebook is vital for all publishers. Not only does this mix insure against sudden changes to Facebook’s algorithms — as seen with the deprioritization of pure link posting — but it actively increases referral traffic.
- If you want to increase traffic, mixing formats is vital. A Page that includes a ratio of different share formats will outperform a Page that doesn’t.
- There isn’t one single optimal image-link share ratio for all publishers. Instead, to find the share ratio that is right for you, you should experiment for yourself through trial and error. Your Page and your audience are unique, so always be wary of advice which claims to identify the ‘one best’ anything.
- Experimenting the right way is really difficult, especially with everything else that busy social media teams have to do. By using Echobox’s automation, you can let Echobox conduct this experimentation for you and respond dynamically to any changes in Facebook’s algorithms. Simply select “Optimal” when setting up your Automation.
- The performance of image shares also depends on a number of other factors that have to do with the presentation of your shares and the expectations of your audience. By experimenting with different kinds of images and share messages you can increase performance further.