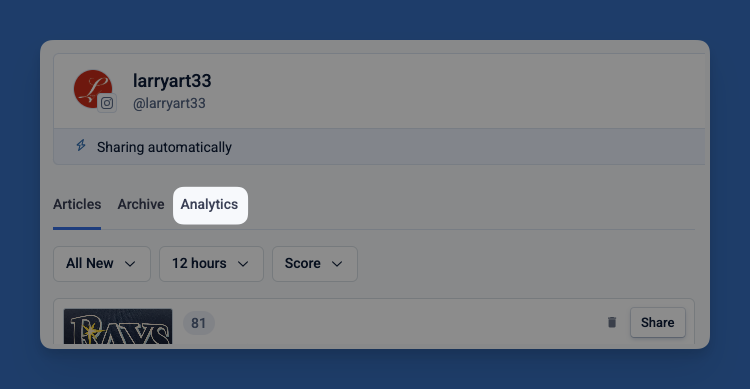
Analytics
The Analytics tab is a section of Echobox that shows the performance of your posts.
Here, you can view the most recent posts or specify a time period for analyzing post performance. You can also sort the table by your chosen metric and filter by parameters such as time classification or content type. Lastly, you can export a CSV file containing performance metrics from all Pages under the current Property.
Where does Echobox get the social media analytics?
We get social media analytics information from a combination of your social media pages and the Echobox Web Tag. We also calculate some further metrics based on the data from these sources.
Since each social network provides different data, you will see different performance metrics on X compared to Facebook and so on.
What does each metric mean?
| Metric | Networks | Description |
| Impressions | Facebook, LinkedIn, Instagram | The number of times a post is loaded on a Facebook, LinkedIn or Instagram user’s feed. |
| Views | TikTok | The number of times a video entered a TikTok user’s screen. |
| Clicks | Facebook, LinkedIn | The total number of times that users clicked on the link in the post. |
| Click-Through Rate (CTR) | Facebook, LinkedIn | The number of Clicks on a post divided by the total Impressions. |
| Engagement | Facebook, LinkedIn | Sum of reactions, comments, and reshares. |
| TikTok | Sum of likes, comments, and shares. | |
|
Feed posts: sum of likes, comments and saves Reels: sum of likes comments, saves and shares Stories: total replies |
||
| The number of engagements divided by the number of impressions (or plays for Reels). | ||
| Reach | The number of unique accounts that were shown the share. | |
| Pageviews | Twitter/X | The number of pageviews the article in the share received from Twitter/X since the share was made. We stop counting 7 days after the share is made. |
What do the labels on the Analytics page mean?
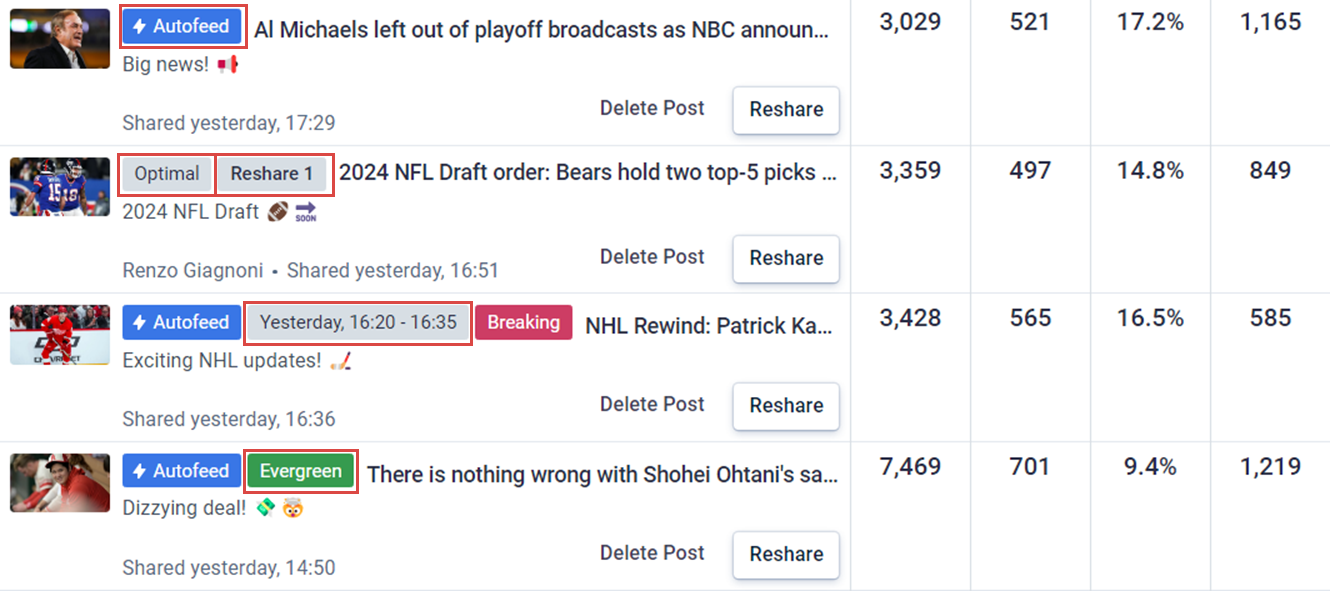
A number of labels can be displayed next to a post’s photo:
- The Autofeed label appears if the article was selected and shared by the Autofeed. All Autofeed shares use Optimal timing. See here for more information.
- The Share Time label is the type of schedule with which the post was shared. Here you can see an example of Optimal share time and Autofeed sharing options chosen.
- The Reshare label tells you if the associated content had been previously shared on this Page.
- The Time Sensitivity label could show Normal, Breaking, or Evergreen depending on the classification of the article. See here for more information.
What is included in the CSV export?
The CSV export includes all of the below headers:
| Header | Content |
| Suggestion ID | A unique ID for each post occurrence |
| Social Network | Which social network the post was shared to |
| Account | A unique ID for your Property |
| Article Title | Title of the shared article |
| Article URL | URL of the shared article |
| Article Published | A unique ID for the article shared |
| Share Type | Whether this share was through an ECHOBOX_SHARE or through a DIRECT_SHARE on your social Page |
| Schedule Type | Whether this share was manually through Echobox as a MANUAL_SOCIAL_SHARE, through Echobox using A/B Testing as a MANUAL_SOCIAL_AB_SHARE, or through the Autofeed as an AUTO_SOCIAL_SHARE |
| Schedule Timing |
SHARE_NOW - If the suggestion has had less than 3 minutes to get shared SHARE_SPECIFIC_TIME- If it has had no time frame in which to get shared (e.g. times between which it should have been shared are the same - from 15:36 to 15:36) SHARE_TIME_SLOT - If it has had some time window within which it should have been shared (e.g from 15:00 to 17:00) SHARE_BREAKING_NEWS - If it has had up to 30 minutes to get shared SHARE_AUTO - Anything else falls in this category, which means Optimal timing |
| Reshares | A Boolean category reflecting whether there are multiple shares of this article to your social page |
| Unix Timestamp | The timestamp in Unix form for tracking time as a running total of seconds |
| Share Time | The time that the article was published on your social Page |
| Time Zone | Time Zone to which your Echobox account is configured for determining optimal share times |
| Share Link | A link to the social media post |
| Labels | If any labels are attached to your post, they would populate here |
| Last Edited By | The email of the user in your Echobox account who last edited the post |
| Facebook Impressions | How many users loaded your article on their Facebook feed |
| Facebook Clicks | How many users clicked the link in the Facebook post |
| Facebook Likes | How many likes the article received on Facebook |
| Facebook Reshares | How many times an article was reshared to your Facebook Page |
| Facebook Comments | How many comments are on the post on your Facebook Page |
| Twitter Clicks | How many users clicked the link in the Tweet. (This is only available if your Bitly is linked to your account) |
| Twitter Favorites | How many favorites your Tweet received |
| Twitter Retweets | How many times your Tweet was retweeted |
| Twitter Replies | How many replies your post received on Twitter |
| LinkedIn Impressions | How many users loaded your post on their LinkedIn feed |
| LinkedIn Clicks | How many users clicked the link in your LinkedIn post |
| LinkedIn Likes | How many likes your post received on LinkedIn |
| LinkedIn Reshares | How many times your post was reshared on LinkedIn |
| LinkedIn Comments | How many comments your post received on LinkedIn |
| TikTok Views | How many views your video received on TikTok |
| TikTok Shares | How many times your video was shared by users on TikTok |
| TikTok Likes | How many likes your video received on TikTok |
| TikTok Comments | How many comments your video received on TikTok |
| TikTok Reach | How many unique users saw your video on TikTok |
| TikTok Full Video Watched Rate | What percentage of users who watched your video watched until the end of the video |
| TikTok Total Time Watched | The sum of the watch time of all viewers of your video on TikTok |
| TikTok Average Time Watched | The total time watched for your video divided by the total number of views for your video on TikTok |
| Instagram Impressions | How many users loaded your post in their feed, or for Reels the number of times the Reel started playing |
| Instagram Reach | How many unique accounts were shown the post |
| Instagram Likes | How many likes your post received on Instagram |
| Instagram Reshares | How many times your post was reshared on Instagram |
| Instagram Comments | How many comments your post received on Instagram |
| Instagram Saved | How many times your Instagram post was saved |
| Instagram Video Views | How many views your video post received on Instagram |
| AB Variation | A label for which variation of the A/B test the post represents |
| Num. of AB Variations | How many versions of your post you tested in A/B Testing |
| Total AB Clicks | How many users clicked on your posts included in A/B Testing |
| AB Performance Boost | Difference between the A/B test post performances |
| AB Var1 | Unique ID for the first variation of the A/B Test post |
| AB Var1: Message | Share Message for the first variation |
| AB Var1: Description | Description of the first variation |
| AB Var1: Title | Title for A/B Testing Version A |
| AB Var1: Image URL | URL for the image associated with the first variation |
| AB Var1: Clicks | Number of times the post was clicked on |
| AB Var1: Impressions | Number of times the post was loaded on a user’s feed |
| AB Var2: | Unique ID for the second variation |
| AB Var2: Message | Share Message for the second variation |
| AB Var2: Description | Description of the second variation |
| AB Var2: Title | Title of the second variation |
| AB Var2: Image URL | URL for the image associated with the second variation of the test |
| AB Var2: Clicks | Number of times the post was clicked on |
| AB Var2: Impressions | Number of times the post was loaded on a user’s feed |
FAQ
Why are my A/B Test results missing from my Analytics Page?
The winning A/B Test version is chosen based on the post with the higher CTR during the testing period. In some cases, a test may fail and you won’t see any information for your A/B Test on your Analytics page. In this case, version A is shared automatically.
Failures usually happen due to a lack of data. To ensure statistically significant results, we recommend A/B testing on Pages with more than 200,000 followers.
Please refer here for further information on A/B Testing.
Why doesn’t Twitter/X have any metrics other than pageviews?
Since Twitter (now X) changed its API rules in early 2023, we can no longer deliver comprehensive analytics.
What does a blank mean on my Analytics page?
There is currently no data for that field associated with that article. For instance, if CTR is empty, it is because not enough data has been gathered to calculate the value. This most commonly happens when the article has not been shared long enough to gather the necessary information.
Can I export a CSV for data spanning more than 3 months?
We don’t support exporting data spanning more than 3 months. When you export your data, that export is cached for 24 hours. This means that anyone who exports the analytics report from your Page, regardless of what time span they select, will receive the cached export for that 24-hour span. Once 24 hours have passed, a new request for exported analytics data is permitted.
How frequently is my analytics data updated?
| Share Age | Facebook/LinkedIn/Instagram | |
| <6 hours | Every 10 minutes | Every 40 minutes |
| <24 hours | Every 30 minutes | Every 2 hours |
| <7 days | Every 12 hours | Every 48 hours |
| >7 days | No longer updated | No longer updated |